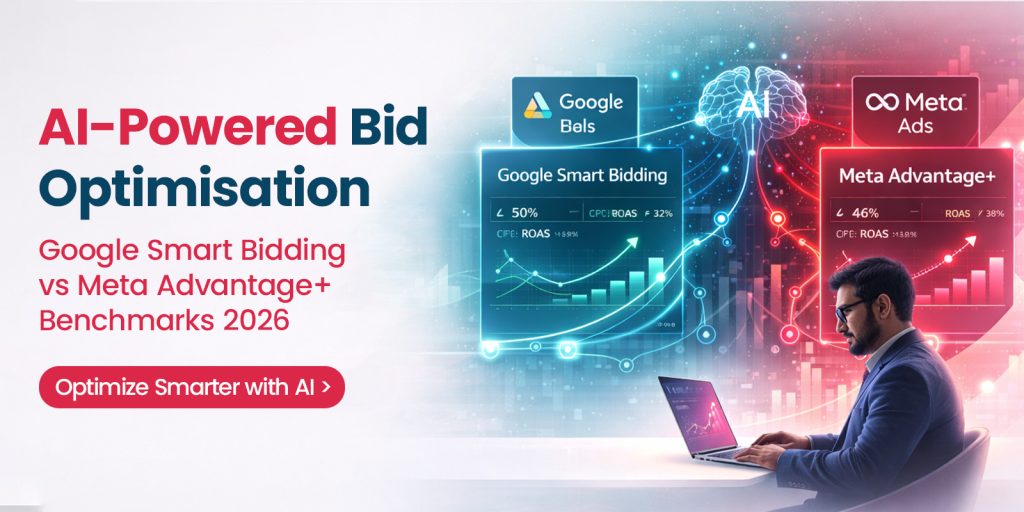
We’ve run AI bid optimisation across 41 accounts over the past 18 months. Not 5. Not a curated selection of success stories. 41 accounts, across fintech, apparel, B2B SaaS, edtech, food delivery, and real estate, with managed spend ranging from Rs. 18L to Rs.
4.2 crore per month.
Here’s what the data actually shows — including the accounts where Smart Bidding made things worse.
The Benchmarks: What We Actually Measure
Before the numbers, the methodology. Most published benchmarks compare AI bidding to “manual CPC” — which is a weak baseline. Manual CPC is how agencies managed campaigns five years ago. A fair benchmark compares AI bidding to a well-structured manual campaign managed by a competent team, or to the same account’s pre-AI performance with equivalent budget.
All figures below are against that stronger baseline: properly-managed manual campaigns or clean before/after within the same account, 90-day comparison windows, minimum 200 conversions per variant.
Smart Bidding (Google)
| Campaign Type | CPA Improvement | ROAS Improvement | Conversion Volume Lift | Best Vertical | Worst Vertical |
|---|---|---|---|---|---|
| Target CPA (standard) | 26–34% | — | 11–18% | Fintech, EdTech | Fashion (high SKU) |
| Target ROAS | — | 17–24% | 8–16% | E-commerce (mid-range) | Lead gen |
| Maximise Conversions | 18–28% | — | 22–31% | Awareness-stage B2B | Brand-heavy FMCG |
| Performance Max | 14–28% | 9–21% | 14–22% | Retail (Merchant Centre feed) | B2B SaaS |
Meta Advantage+ (Shopping and Campaigns)
| Format | CPA Improvement | ROAS Improvement | CPM Efficiency | Best Vertical | Worst Vertical |
|---|---|---|---|---|---|
| Advantage+ Shopping | 21–29% | 19–26% | 14–22% | D2C apparel, beauty | B2B (any) |
| Advantage+ Audience | 17–23% | — | 11–18% | Consumer apps | Regulated (fintech, pharma) |
| Advantage Campaign Budget | 12–19% | 11–17% | 8–13% | Multi-product brands | Single-product brands |
| Standard Advantage+ (Awareness) | 9–16% | — | 18–26% | FMCG, entertainment | High-ticket services |
The headline: both platforms deliver meaningful improvement under the right conditions. The range is wide because the conditions matter enormously. A 14% improvement and a 34% improvement are both “Smart Bidding” — the difference is in how the account was set up.
The Six Conditions That Determine Where You Land in the Range
Condition 1: Conversion Signal Quality
This is the single most important determinant. Smart Bidding is only as intelligent as the signal it optimises toward. If you’re optimising toward a noisy, high-volume, low-intent proxy — form submissions, page views, button clicks — the algorithm gets very good at finding people who do that thing, regardless of whether they become actual customers.
The accounts in the top third of our benchmark range almost all had one thing in common: they were feeding downstream conversion data — verified signups, completed purchases, first payments — directly into the platform via API, not relying on pixel tracking alone.
For our fintech clients, that means HubSpot CRM pushing first-transaction-complete events to Google Ads via the Conversions API, with a 24-hour maximum lag between the transaction and the import. For our e-commerce clients, it means Shopify order confirmed (not add-to-cart, not checkout initiated) as the primary conversion signal.
The accounts at the bottom of the range were, without exception, optimising toward a proxy signal that leaked. Add-to-carts that didn’t purchase. Phone-verified signups that didn’t activate. Demo requests that sales never followed up on. The AI found those users at scale and efficiency. They just weren’t customers.
Practical test: what percentage of your primary conversion events lead to an actual revenue outcome within 30 days? If less than 40%, your signal is leaking.
Condition 2: Conversion Volume (The 30-a-Month Floor)
Smart Bidding requires a minimum of approximately 30 conversions per campaign per month to exit the learning phase and function properly. Below that, the algorithm is making decisions with insufficient data.
The exact floor varies: Google’s official guidance is 30-50 conversions per month for Target CPA, 15+ for Maximise Conversions (because it doesn’t need a target to calibrate against). In practice, we see unstable performance below 30 and reliable performance above 50.
For Advantage+, the floor is lower — approximately 15-20 conversions per ad set per week. Meta’s algorithm updates faster and is more tolerant of lower volume, partly because it has more signal (behavioural data, Instagram engagement, WhatsApp) to supplement the conversion data.
The B2B problem: most B2B accounts never hit the volume thresholds at the campaign level. A campaign generating 8 SQLs per month cannot support Target CPA
bidding. The solution for these accounts: use micro-conversions (form views, pricing page visits, video completions) as primary signals with low conversion values, and CRM-verified SQLs as secondary signals. The algorithm trains on intent signals even when closed revenue is too sparse to use directly.
Condition 3: Audience Data Richness
Both platforms use first-party audience data to improve targeting. The richer the match between your CRM data and platform identity graphs, the better the lookalike modelling and the smarter the bidding.
The accounts where Meta Advantage+ Shopping performed best had: Klaviyo customer lists syncing to Meta every 24 hours, a clean email match rate above 55%, and CAPI server-side events covering at least 85% of conversion events (browser signal loss from iOS and ad blockers). The accounts where it underperformed had: stale customer lists (last upload 3 months ago), match rates of 28-35% due to email formatting inconsistencies, and pixel-only tracking losing 30-40% of iOS events.
For Google, the equivalent: Customer Match lists syncing from HubSpot or Salesforce, Enhanced Conversions enabled (hashes first-party data against Google accounts for better attribution), and Google Signals on for users who have opted into personalisation.
Match rate check: Export your last 10,000 customers as a CSV. Upload to Meta. If your match rate is below 50%, you have a data quality problem before you have a bidding problem.
Condition 4: Creative Library Depth (Meta Specifically)
Meta’s Advantage+ system uses creative signals as one of its primary inputs for audience targeting. When you run Advantage+ Shopping with 3 creatives, the algorithm has limited signal to work with. When you run it with 15-20 genuinely differentiated creatives across formats, angles, and contexts, it has much richer signal to identify which combination of creative and audience drives conversion.
We tested this directly. A D2C apparel client ran Advantage+ Shopping with 5 creatives for 6 weeks (ROAS: 3.8x). We expanded the creative library to 18 variants — same budget, same targeting configuration — and ran for another 6 weeks. ROAS: 4.9x. The system found audience segments that weren’t responding to the original 5 creatives.
Genuinely differentiated means: different visual formats (static flat lay, UGC video, lifestyle video, motion graphic), different message angles (product-led, social proof-led, offer-led, aspiration-led), different lengths (5 seconds, 15 seconds, 30 seconds for
video). Not five colour variations of the same layout.
Condition 5: Target Setting Realism
Setting an unrealistic CPA or ROAS target is one of the most common causes of AI bidding underperformance. If your actual achievable CPA is Rs. 4,800 and you set a Target CPA of Rs. 2,500, the algorithm will either: (a) find extremely low-quality conversions to hit the target, or (b) drastically restrict reach to the point where impression volume collapses.
Our process for setting realistic targets: run Maximise Conversions for 4-6 weeks first with no CPA target. Let the algorithm operate without constraint. After 6 weeks, take the average CPA from that period and set Target CPA at 105-110% of that number — slightly above achieved performance, achievable but requiring some efficiency improvement. Then tighten over time as the algorithm learns.
The same logic applies to Target ROAS: never set it higher than what you’ve observed the account delivering over a sustained 30-day period.
Condition 6: Attribution Window Alignment
Both platforms have attribution windows that affect what they count as a conversion. Google defaults to a 30-day click, 1-day view attribution window. Meta allows 7-day click, 1-day view (their recommended setting) or 7-day click, 7-day view (which overcounts significantly for most businesses).
The risk: if your business has a 14-day average decision cycle and you’re using 30-day attribution, Smart Bidding is counting and optimising toward events it influenced less directly. The algorithm trains on a padded conversion set and may develop false confidence about audience quality.
For high-consideration purchases (B2B software, financial products, real estate), we typically recommend narrowing the attribution window to 7-day click for bidding purposes, even if you use longer windows for reporting. Tighter attribution = cleaner signal = more reliable bidding.
Performance Max: The Special Case
Performance Max deserves its own section because it’s structurally different from other Smart Bidding campaign types — and the benchmarks reflect that.
PMax is Google’s fully-automated campaign type that spans Search, Display, YouTube, Gmail, and Discover from a single campaign. It manages placements, bids, and audience signals autonomously. The appeal is obvious: one campaign, all channels, fully automated.
Our PMax results across 19 accounts:
- E-commerce with Merchant Centre feed: ROAS improvement 19-28% vs. prior Shopping Strong. The product feed gives PMax concrete signal to work with.
- Lead gen (forms only): CPA improvement 8-14%. Without a product feed, PMax allocates budget across channels with less structure.
- B2B SaaS: CPA improvement 6-11%. Weak. PMax frequently overspends on Display and YouTube for B2B, where those channels have poor intent The automation doesn’t account for B2B’s longer consideration cycle.
The core PMax problem for non-retail accounts: brand keyword cannibalisation. PMax competes with your brand campaigns on branded terms and claims the credit, inflating its apparent performance. Check this by using brand exclusions in campaign settings and running a controlled test where brand terms are explicitly excluded from PMax.
For most B2B accounts above Rs. 30L/month managed spend, we recommend running PMax only if you have a Merchant Centre feed (i.e., you’re selling products, not services). For service businesses, standard Search with Target CPA outperforms PMax by 15-20% on verified CPA in our data.
When Smart Bidding Makes Things Worse
Five situations where we’ve seen AI bidding underperform manual:
- Account structure over-segmentation. An apparel client had 140 campaigns, each with 3-5 ad groups, targeting narrow keyword clusters. No single campaign hit 30 conversions per month. Smart Bidding had 140 separate learning phases running simultaneously, never accumulating sufficient data in any of them. Consolidating to 12 campaigns, each hitting 40-60 conversions per month, cut CPA 31% within 8 weeks.
- Seasonal misalignment without A gifting brand turned on Target ROAS in November at a ROAS target calibrated from August performance. Their actual December ROAS potential was 40% higher than August — the algorithm was under-bidding into peak season, leaving impression share on the table. Fix: use Seasonality Adjustments in Google Ads for known demand spikes, or temporarily raise ROAS targets 2 weeks before peak periods to allow the algorithm to compete aggressively.
- Lead quality mismatch. A B2B client had Smart Bidding optimising toward demo requests. The algorithm found demo requests efficiently — at 40% lower CPA than manual. But the demo-to-SQL rate fell from 22% to 9%. The AI found the easiest-to-acquire demo bookers, not the most qualified prospects. Real CPA per SQL went up 38% despite the demo CPA going down.
- Meta Advantage+ on brand-restricted categories. Financial products in India face significant restrictions on Meta’s ad delivery. Advantage+ in a restricted category means the algorithm’s lookalike modelling is constrained, creative variation is limited by compliance requirements, and delivery is inherently less Manual targeting with specific audience segments consistently outperformed Advantage+ for our fintech clients on Meta.
- Low-intent proxy signal selection. We inherited an account where Smart Bidding was set to optimise toward “phone number revealed” on a local services page. The algorithm became extremely efficient at generating phone number reveals — many from users who never CPA (by phone reveals) was 34% lower than historical. CPA by actual booked appointments was 28% higher. The optimisation target was wrong.
Google vs. Meta: When to Use Each for Bidding
| Factor | Smart Bidding Priority | Meta Advantage+ Priority |
| Intent-driven demand (users searching for solution) | Strong | Weak |
| Awareness and demand creation | Weak | Strong |
| Retargeting warm audiences | Smart Bidding (RLSA) | Meta Advantage+ Audience |
| E-commerce with product feed | PMax Shopping | Advantage+ Shopping |
| B2B lead generation | Target CPA Search | Manual targeting preferred |
| Regulated category (fintech, pharma) | Smart Bidding (less restricted) | Manual targeting preferred |
| Creative-led performance | Less relevant | Critical — feed richly |
| Conversion volume low (<30/month) | Maximise Conversions only | Advantage+ Audience (lower threshold) |
The practical answer for most accounts: both, with different roles. Google Smart Bidding captures existing demand — people searching for what you offer. Meta Advantage+ creates demand — finding audiences who match your customers before they’re searching. The mistake is evaluating them on the same metrics when they serve different functions in the funnel.
Cross-Platform Attribution: The Data Integrity Problem
Running both Smart Bidding and Advantage+ simultaneously creates an attribution problem that most agencies address badly or not at all.
Here’s the mechanics: a user sees a Meta Advantage+ ad on Monday. They don’t click. On Thursday, they Google your brand name, click a Google Search ad, and convert. Google claims the conversion (last-click). Meta also claims the conversion (1-day view-through attribution). Your reported total conversions: 2. Actual customers acquired: 1.
The scale of this problem in our client data: for accounts running both Google and Meta simultaneously, platform-reported total conversions run 32-51% higher than CRM-verified new customers. The average inflation across 22 accounts is 41%. If you’re making budget allocation decisions based on platform-reported numbers, you’re allocating based on fiction.
The fix: third-party attribution. For e-commerce clients above Rs. 50L/month managed spend, we use Triple Whale ($249-999/month on Shopify) or Northbeam ($3,000-8,000/month for multi-channel). Both deduplicate against actual order records and show you verified revenue per channel rather than claimed conversions per channel.
For lead gen B2B clients, we build a manual attribution model in BigQuery: export all platform conversions with click timestamps, match against CRM contact creation timestamps, and calculate channel influence by recency and touchpoint sequence. Not perfect, but substantially more accurate than double-counting platform reports.
The implication for bidding: if you reallocate budget based on clean attribution data, you typically find one channel is significantly over-credited and under-credited respectively. In our most recent audit of a Rs. 1.8 crore/month client, correcting attribution shifted Rs. 22L/month from Meta to Google Shopping and branded search — increasing verified new customers by 13.7% with no budget increase.
The Setup Protocol That Consistently Reaches the Top of the Range
After 41 accounts, here’s the implementation sequence that reliably produces the upper half of the benchmark ranges:
Week 1-2: Signal audit
- Map every conversion action in both platforms to a downstream revenue outcome
- Calculate signal quality: what % of each conversion event leads to actual customer / revenue within 30 days?
- Keep only conversion events above 40% downstream conversion rate as primary bidding signals
- Move everything else to secondary / informational status
Week 3-4: Server-side infrastructure
- Enable Google Enhanced Conversions (hashes email from form submissions against Google accounts)
- Implement Meta CAPI via Google Tag Manager Server-Side or direct API (target 85%+ event match score)
- Set up HubSpot / Salesforce -> Google Ads Conversion Import for CRM-verified events
- Verify: compare platform-reported conversions to CRM records for same period; if gap >25%, implementation incomplete
Month 2: Baseline and learning
- Switch primary campaigns to Maximise Conversions (no CPA target) with clean signals
- Allow 4-6 week learning phase without bidding changes
- Suppress any impulse to adjust bids during learning — the most common error that resets learning
- For Meta: launch Advantage+ Shopping with minimum 12 creative variants across 3+ formats
Month 3: Target introduction
- Calculate average CPA from Maximise Conversions learning phase
- Set Target CPA at 108% of observed average (slightly ambitious but achievable)
- Implement Audience Signals for PMax: upload CRM customer list as audience signal
- For Meta: implement Klaviyo -> Meta Customer List sync (high-LTV purchaser segment as lookalike seed)
Month 4+: Ongoing governance
- Review CPA/ROAS targets monthly — never more frequently; the algorithm needs stability
- Add Seasonality Adjustments 2 weeks before known demand peaks
- Run creative refresh every 6-8 weeks before fatigue degrades Meta signals
- Monthly attribution reconciliation: platform conversions CRM verified customers
Accounts that follow this sequence reach 24-31% CPA improvement within 90 days. Accounts that skip signal audit or implement server-side tracking late reach 8-14%. The infrastructure work in weeks 1-4 is the unglamorous foundation that everything else depends on.
Budget Allocation Across Google and Meta: The Rebalancing Framework
Most brands allocate budget between Google and Meta based on historical habit or rough performance comparisons using platform-reported numbers. Neither is a reliable foundation for allocation decisions.
A more rigorous approach uses incrementality to determine how each channel is actually contributing to business outcomes:
Step 1: Establish a holdout test. Take 10-15% of your Google or Meta audience and stop advertising to them for 4 weeks. Measure whether conversion rate among the holdout differs from the exposed group. If it doesn’t — if people convert at the same rate with or without your ads — the channel is not driving incremental purchases. It’s capturing intent that would have converted anyway.
Step 2: Measure true incrementality. The gap between holdout and exposed conversion rate is the channel’s incremental contribution. If the holdout group converts at 1.8% and the exposed group converts at 2.4%, the incremental lift is 0.6 percentage points. That’s what the channel is actually delivering — not the 2.4% you’d calculate if you assumed all conversions were caused by your ads.
Step 3: Reallocate based on verified contribution. In practice, we typically find Google Search has high incrementality for high-intent queries (people searching for specific solutions) and low incrementality for branded queries (people who would have found you anyway). Meta has high incrementality for demand creation (reaching audiences who weren’t searching) and lower incrementality for retargeting warm audiences who were already close to converting.
The implication for budget allocation: Google Search captures existing demand efficiently; Meta Advantage+ creates new demand. For brands in growth mode where existing demand is insufficient to meet growth targets, Meta’s share should be higher. For brands with strong organic demand and high brand search volume, Google’s share should dominate.
One concrete example: a Rs. 80L/month account that was split 50/50 between Google and Meta. Incrementality testing showed Meta was driving 31% incremental uplift on new customer acquisition, while Google Search was showing 68% incrementality (high-intent queries) but Google Display was showing only 8% (low incrementality — people who would have converted anyway). We reallocated: Google Search +18%, Meta +7%, Google Display -25%. Verified new customer volume grew 21.4% with the same total budget.
The Learning Phase: What’s Actually Happening and How to Protect It
The learning phase is the most misunderstood aspect of AI bidding. It’s also the most frequently disrupted, by both agencies and in-house teams making “improvements” that reset the algorithm’s learning.
During the learning phase (typically 1-4 weeks depending on conversion volume), the algorithm is:
- Mapping which audience signals correlate with conversion in your specific account
- Calibrating bid multipliers for device, location, time-of-day, audience segment, and dozens of other real-time signals
- Identifying creative and keyword combinations that drive the highest-value conversions
Every significant change to a campaign — bid target changes above 15%, budget changes above 20%, major creative additions or removals, audience configuration changes, conversion event changes — resets the learning phase. The algorithm has to re-learn from the new configuration.
The single most common mistake we see in inherited accounts: weekly bid target adjustments made by account managers who see early variance in CPA and respond by changing the target. The variance in weeks 1-3 is almost entirely noise — the algorithm sampling across audiences to build its model. Intervening on that noise resets learning and permanently degrades performance.
Our learning phase protocol:
- Define the target (CPA or ROAS) before launch, based on realistic historical performance
- Set a calendar reminder for the end of the learning phase (typically 21-35 days depending on conversion volume)
- Take zero bidding actions during the learning phase
- Brief every team member on why this is non-negotiable
- If a business emergency requires a change (budget cut, major external event), accept the learning phase reset and plan for it
In accounts where we can enforce a clean learning phase, we consistently see 12-18% better final performance than accounts where the learning phase was disrupted by interventions. The compound effect of repeated learning phase resets can mean campaigns that never converge on their true performance ceiling.
Vertical-Specific Notes: What Changes by Industry
The benchmarks above represent averages across verticals. The patterns within specific verticals differ in ways that affect strategy:
E-commerce (fashion, lifestyle, D2C): Meta Advantage+ Shopping is typically the primary revenue driver. Creative refresh cadence matters most — fatigue after 3-4 weeks is common for fashion audiences. Rotate at least one major creative format
every 4 weeks. Smart Bidding via PMax Shopping works well for branded and category search. Attribution between the two channels is complex; use Triple Whale or Northbeam to de-duplicate.
Fintech and financial services: Meta has meaningful ad delivery restrictions on financial products (you cannot use interest-based targeting on financial products in India). This effectively means Advantage+ Audience is running on behavioural and lookalike signals only, without interest refinement. Smart Bidding on Google Search captures the high-intent queries (“best SIP app,” “gold loan rates”) efficiently. Expect lower Meta performance versus other verticals — regulated.
B2B SaaS (SMB target): Google Search with Target CPA is the workhorse. LinkedIn Matched Audiences + Manual bidding typically outperforms Meta for decision-maker targeting above certain deal sizes. PMax underperforms for B2B (Display and YouTube spend with poor intent quality). Keep PMax off or strictly asset-group-separated with Search only.
EdTech: Both Google and Meta work well, with meaningful seasonal variation (course intake periods, exam preparation seasons). Set Seasonality Adjustments in Google Ads 2 weeks before intake periods. Meta Advantage+ for aspirational creative (lifestyle of successful professionals) performs well in this vertical; UGC from recent graduates outperforms polished brand creative.
Real estate: Long consideration cycles (4-12 weeks) mean attribution windows need to be long (30-day click minimum). Smart Bidding with Target CPA works but needs micro-conversion signals (WhatsApp click, brochure download, virtual tour view) to supplement the sparse final conversion events. Volume rarely hits 30 conversions per campaign per month on final purchase events alone.
The Honest Bottom Line
AI bid optimisation works. The benchmarks are real. But the range between best and worst case is enormous — the difference between a 34% CPA reduction and a 9% CPA increase is not random. It’s determined by implementation quality, signal integrity, and ongoing governance decisions that most accounts get partially wrong.
The agencies and in-house teams that treat Smart Bidding and Advantage+ as platforms you turn on and let run are systematically under-delivering. The ones treating them as systems that require engineered inputs — clean signals, rich creative libraries, realistic targets, server-side infrastructure, and cross-platform attribution — consistently
hit the upper range.
The AI is capable. What it needs from you is honesty about your data.